How Much Do Cars Depreciate per Year? UK Data
See how much do cars depreciate per year in the UK, with a year-by-year table, key factors and tips to buy or sell at the right time.
How Much Do Cars Depreciate per Year? UK Data
A new car can lose 15% to 35% of its value in the first year alone, and by year three it's often worth barely half what you paid. If you're trying to work out how much do cars depreciate per year before buying or selling, guessing gets expensive fast. This article gives you the actual UK figures, not vague estimates.
On average, UK cars depreciate by around 15-20% annually after that steep first-year drop, though the exact rate depends heavily on make, model, and mileage. A Ford Fiesta holds its value very differently to a BMW 3 Series, and diesel versus petrol, service history, and even paint colour all shift the numbers. We'll break down the year-by-year percentages so you can see exactly where a specific car sits on that curve.
Below, we cover the typical depreciation timeline from year one through year ten, which factors accelerate or slow the drop, and how to estimate a fair resale price using real data. Before you commit to any used car, running a free history check on its registration plate also tells you whether it's been written off, stolen, or still has finance owing, all of which hit resale value hard.
Why car depreciation matters for buyers and sellers
Depreciation isn't just an abstract number, it's the single biggest cost of owning a car, often outstripping fuel, insurance, and maintenance combined, so it pays to understand how car depreciation works. Understanding how much do cars depreciate per year helps you avoid two expensive mistakes: buying a car at the wrong point in its depreciation curve, or selling one too early and leaving money on the table.
For buyers: avoiding overpaying
When you're shopping for a used car, knowing the typical annual depreciation rate tells you whether an asking price is fair or inflated. A three-year-old car priced close to its original retail value is a red flag, since most vehicles have already shed 50-60% of their worth by that point. Buyers who understand this curve can negotiate with confidence, pointing to real depreciation data rather than guesswork.
A car's price tag only tells you what someone wants for it, depreciation data tells you what it's actually worth.
For sellers: timing your sale
If you're selling, depreciation dictates timing. Cars lose value fastest in the first three years, so trading in or selling before that steep drop kicks in usually nets you more money than waiting until year five or six. Selling privately rather than trading in at a dealer also softens the hit, since dealers factor their own margin into the depreciation they pass on to you.
Why this matters beyond price
Spotting unusual depreciation patterns can also flag hidden problems. A car that's lost value far faster than its resale value should suggest might have a poor MOT history, accident damage, or an issue buyers are quietly avoiding. This is exactly why checking a vehicle's background before you buy or price a sale matters: a free car check reveals MOT history, mileage records, and insurance write-off records that explain why one car holds its value better than an identical-looking model down the road.
Whether you're buying or selling, depreciation isn't something to react to after the fact. Treat it as a planning tool from the start, and you'll make better decisions on price, timing, and which car to choose in the first place.
How to calculate your car's depreciation
Working out how much do cars depreciate per year for a specific vehicle only takes basic maths, provided you know the original price and current value. The simplest formula is:
Annual depreciation rate = ((Original value - Current value) / Original value) / Number of years owned x 100
Say you bought a car for £20,000 and it's now worth £14,000 after three years. Subtract to get a £6,000 loss, divide by £20,000, then by three years, and you get roughly 10% depreciation per year on average, even though the actual drop was steeper in year one.
Depreciation rarely falls in a straight line, so an average percentage hides the real story of a car's first year.
To get a realistic current value, check recent selling prices for the same make, model, age, and mileage on sites like Auto Trader or through an instant valuation by registration, rather than relying on what you originally paid. Comparing three or four similar listings gives you a more accurate benchmark than a single guess, and this guide to working out what your car is worth online walks through the process step by step.
Finally, factor in condition and history. Two identical models can have wildly different depreciation once you account for accident damage, missed services, or a patchy MOT record, so always pair the maths with a proper background check before trusting the number.
Average car depreciation rates by year in the UK
Most UK cars follow a predictable curve, even if the exact numbers shift by model. Looking at typical new car depreciation patterns across the market gives you a benchmark to compare any specific vehicle against, rather than relying on a single average figure that hides how front-loaded the losses really are.
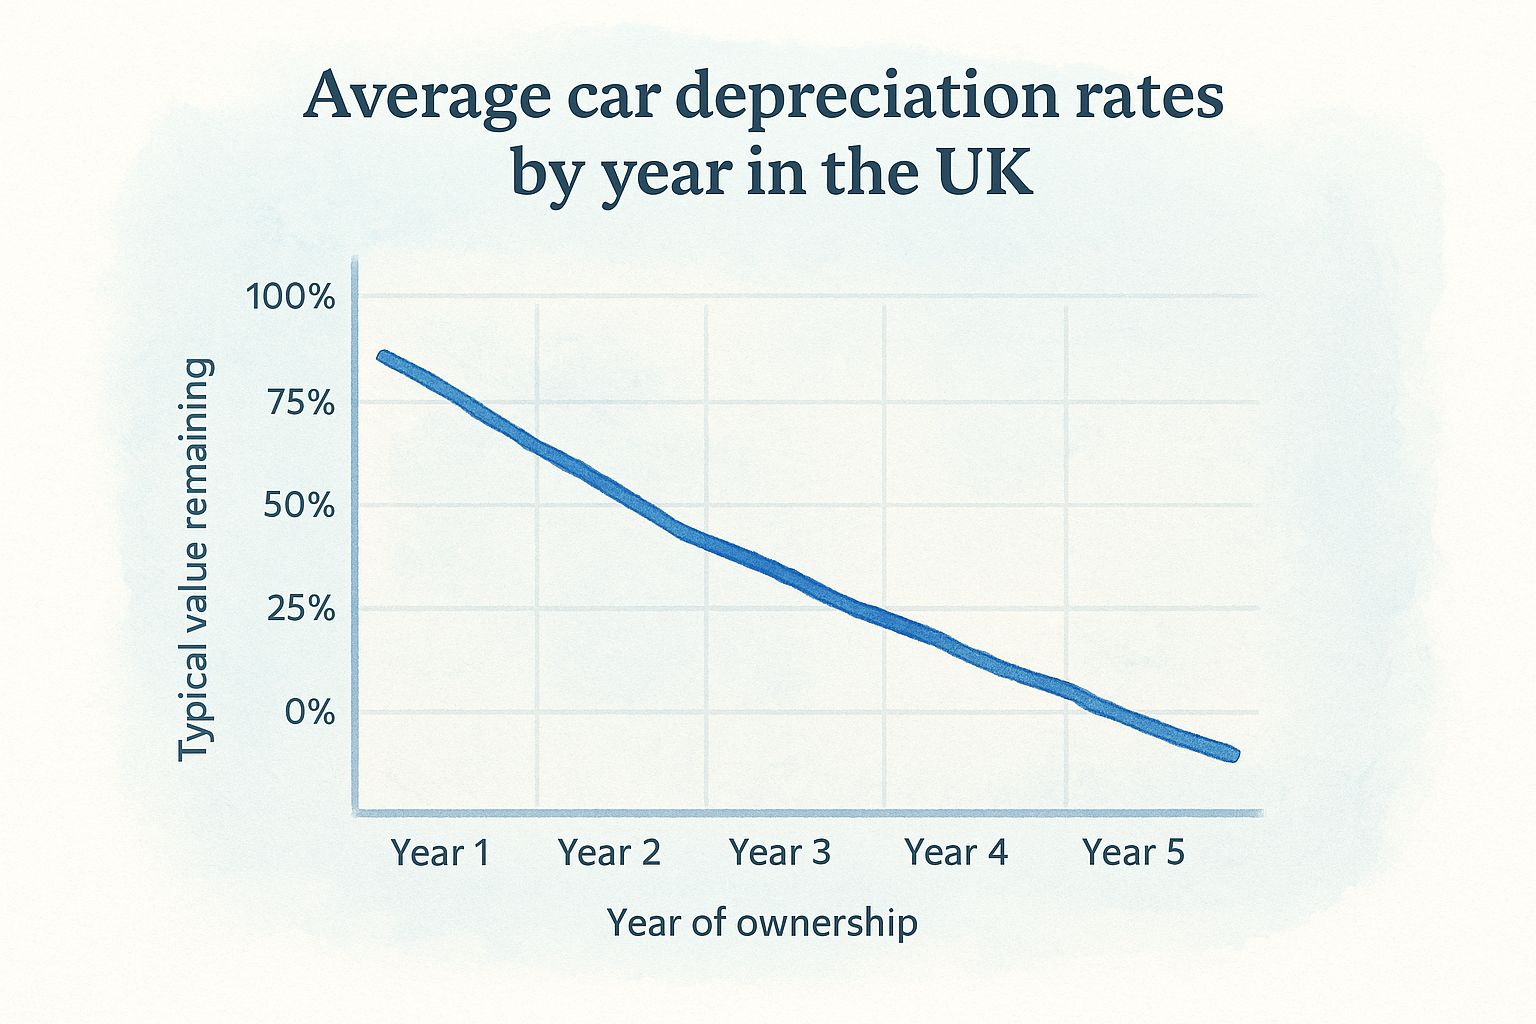
| Year of ownership | Typical value remaining | Approximate annual drop |
|---|---|---|
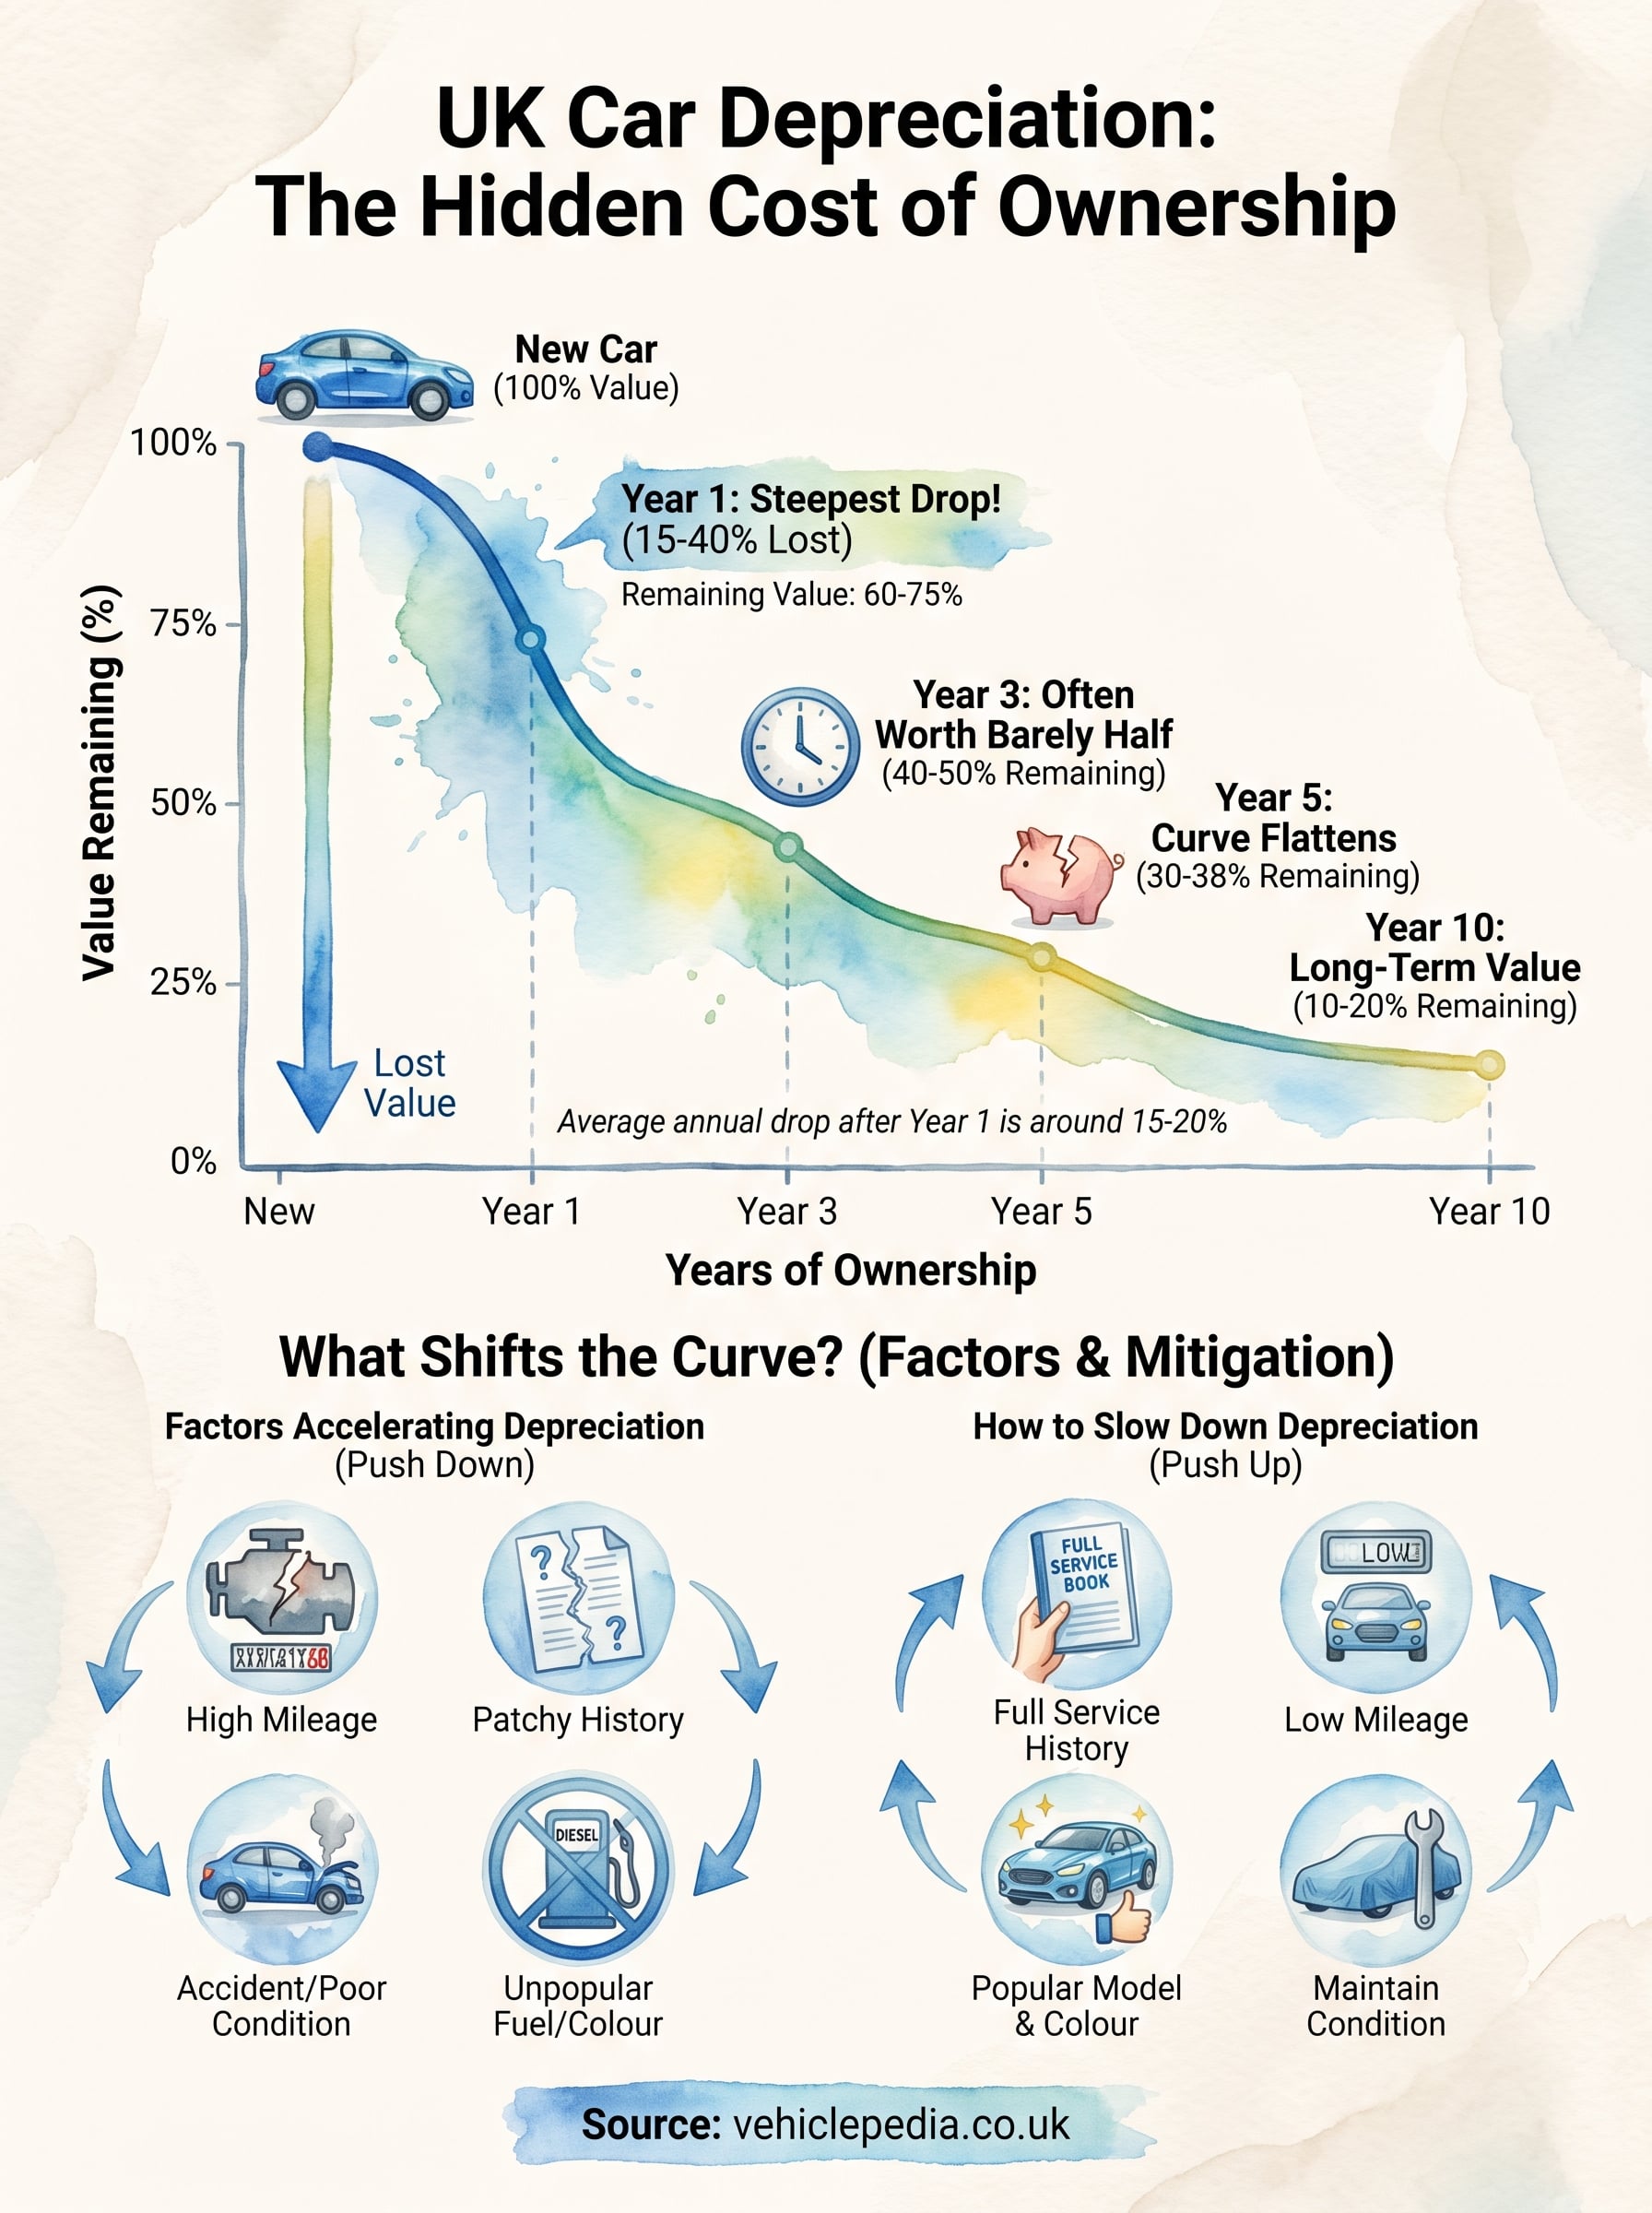
| Year 1 | 60-75% | 25-40% |
| Year 2 | 50-60% | 10-15% |
| Year 3 | 40-50% | 8-12% |
| Year 4 | 35-42% | 6-10% |
| Year 5 | 30-38% | 5-8% |
| Year 10 | 10-20% | 3-6% |
Notice how the biggest hit lands immediately, then the curve flattens. A £25,000 car might drop to around £16,000 within twelve months, then only fall to roughly £13,000 by year two.
The first year does more damage to a car's value than the next four combined.
Overall, used car depreciation slows considerably once a vehicle passes the five-year mark, which is exactly why buying a three or four-year-old car often represents better value than buying new. Past year ten, depreciation nearly stalls, since remaining value reflects mechanical condition and mileage more than age alone. These figures are averages though, and the next section covers exactly what pushes individual cars above or below this curve.
What affects how fast a car loses value
Several factors push a car above or below the average curve, and knowing them helps you predict how much do cars depreciate per year for a specific vehicle rather than relying on generic percentages. Brand reputation, running costs, and even bodywork condition all play a part, sometimes shifting the annual rate by 10% or more compared to a similar model.
Make, model, and demand
Japanese and German brands like Toyota and BMW tend to hold value better than volume brands, largely because of stronger reliability reputations and steady used-car demand. Popular colours, low-emission engines, and manual versus automatic gearboxes also swing resale appeal depending on regional buyer preferences.
Two identical cars can depreciate at completely different rates once mileage, colour, and service history enter the equation.
Mileage, condition, and history
High mileage accelerates vehicle depreciation sharply, since buyers assume more wear on the engine and drivetrain. A full service history, clean MOT record, and no accident damage all slow the drop, while a missing logbook or patchy paperwork does the opposite.
- Mileage well above the UK average of 7,000-8,000 miles per year
- Non-standard modifications or unpopular colour choices
- Diesel engines losing favour in low-emission zones
- Multiple previous owners or gaps in service records
- Prior accident damage, even if professionally repaired
Each of these factors compounds, so a high-mileage diesel with patchy history can depreciate far faster than the averages suggest.
How to slow down your car's depreciation
You can't stop a car losing value entirely, but you can control how fast it happens. The choices you make before and after buying often matter more than the badge on the bonnet, and small habits add up to thousands of pounds saved at resale.
Choose wisely before you buy
Picking a model with strong residual value history, sticking to popular colours, and avoiding heavy customisation all protect your investment from day one, and it helps to know which UK cars hold their value best before you sign anything. Diesel buyers should think carefully too, since low-emission zone restrictions are pushing demand towards petrol and hybrid alternatives in many UK cities.
The car you choose matters more for depreciation than almost anything you do to it afterwards.
Maintain it properly
Keeping a full service history and staying on top of MOTs does more for resale value than any cosmetic upgrade. Buyers pay a premium for paperwork that proves a car's been looked after, and gaps in that record raise doubts even when the car itself is fine mechanically, so it's worth knowing how to check a car's service history before you buy or sell.
- Service the car on schedule, even after the warranty ends
- Keep mileage close to the UK average rather than racking up extra miles
- Fix minor bodywork damage before it becomes a bigger cosmetic issue
- Retain all receipts, MOT certificates, and the original logbook
Together, these steps won't eliminate depreciation, but they'll consistently place your car above the average curve rather than below it.
Keeping depreciation in mind
Knowing how much do cars depreciate per year turns guesswork into a plan. The first-year hit is unavoidable, the next few years follow a predictable curve, and after that things settle down considerably. Whether you're buying or selling, that timeline should shape your decisions as much as the asking price does.
Remember that averages only tell part of the story. Mileage, service history, and hidden damage can push a specific car well above or below the typical curve, which is why the maths alone never gives you the full picture. Pair depreciation figures with a proper background check before you hand over any money, so you know exactly what you're paying for and what it'll likely be worth down the line.
Want to see what that kind of detail looks like in practice? See exactly what a full Vehiclepedia report reveals before your next purchase.